- The Opening Print
- Posts
- Markets Remain Dicey Ahead of Fed
Follow @MrTopStep on Twitter and please share if you find our work valuable!
Every week, MrTopStep invites traders to an “Own the Close” contest where the closest guesstimate where the SPX will settle on Friday’s 4:00 cash close.
The winners get a free week's access to the MrTopStep Chat and trading tools. Enter your guess now!
Our View
As of April 30th, the S&P has gone 138 days without a 10% correction — still short of the 172-day average since 1928. But the ES has jumped 24% in the past six months (about 185 days), which supports arguments for a correction.
According to FactSet, the multiyear rally has arguably sent stocks to overvalued levels. The S&P 500’s forward PE ratio — a gauge of market valuation based on earnings estimates for the next 12 months — stood at ~20 as of April 26, exceeding the five-year average of 19.1 and the 10-year average of 17.8.
According to a CFRA analysis of S&P data, corrections generally don’t stick around long. Since 1985, declines between 10% and 20% for the S&P 500 have lasted only 97 days on average — or about three months.
Yesterday was an overload. Secretary Janet Yellen came under fire from Republican lawmakers over a quip from President Joe Biden about letting tax cuts enacted by predecessor Donald Trump expire. Yellen repeatedly emphasized that the administration’s principles on tax policy had not changed and that Biden supports retaining tax. Below are a few headlines from her testimony.
YELLEN: BIDEN HAS BEEN CLEAR THAT ANYONE UNDER $400000 WILL NOT FACE TAX INCREASES
US TREASURY SECRETARY YELLEN: I AM CONCERNED ABOUT WHERE WE'RE GOING WITH THE US DEFICIT.
US TREASURY SECRETARY YELLEN: THE US NEEDS SIGNIFICANT STEPS TO REDUCE BUDGET DEFICIT.
There were so many headlines it was impossible to keep up.
Our Lean — Danny’s Trade
This is Danny Riley’s personal trading plan for the day.
To get this delivered daily, please consider upgrading to a paid membership.
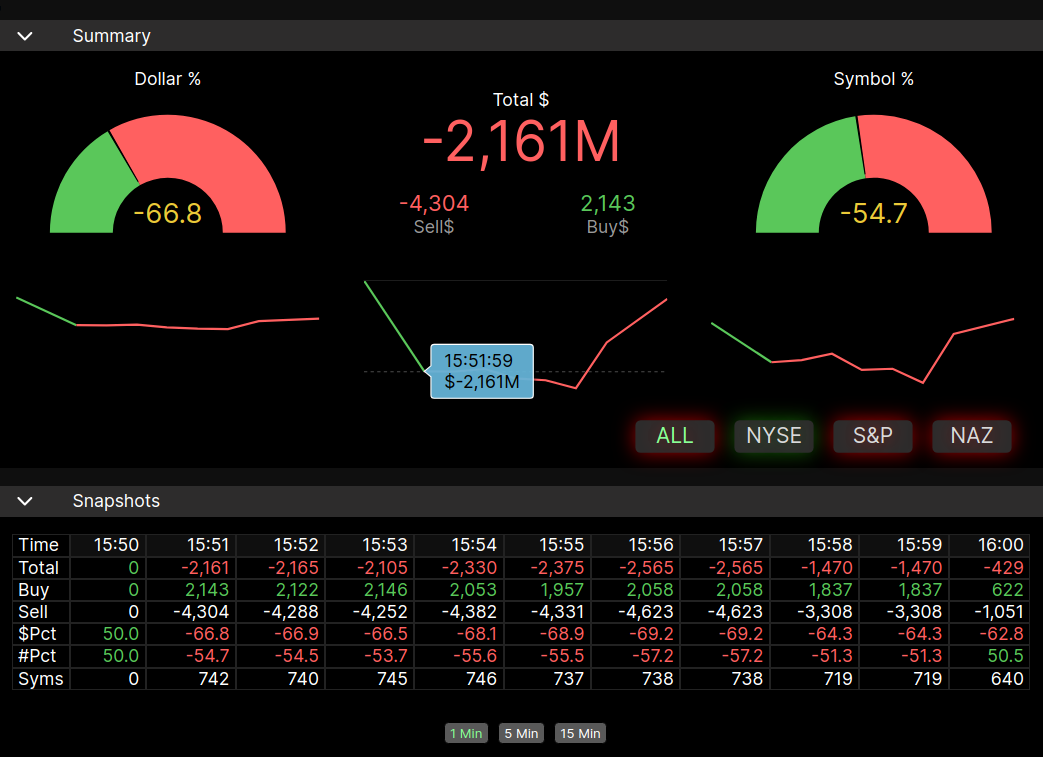
MiM and Daily Recap

ES Recap
The ES traded down to 5120.50 on Globex and opened Fed Tuesday at 5131.00. After the open, the ES made a 5127.25 double bottom at 9:33, rallied up to 5141.25 at 9:45, pulled back to 5133.25 at 9:55, back and filled around the VWAP, and traded back up to the high at 5141.25 at 10:08. The ES pulled back to 5133.25 and then rallied up to a lower high at 5140.50 at 10:20. That high set up the sell-off down to 5126.25, then the ES rallied up to another lower high at 5139.00 and then sold off down to a 5105.25 at 11:55, rallied back up to 5115.25 at 12:25 and then dropped 18.75 points straight down to 5096.00 at 12:35. After the new low, the ES rallied back up to 5102.75, dropped down to 5092.50 at 12:48, rallied up to 5102.00 at 1:04, sold off down to a new low at 5091.50 at 1:12, rallied 18.25 points up to 5110.25 at 2:00 and then slowly down-ticked to 5088.50 at 2:51.
After the low, the ES rallied back up to 5097.75 at 3:15 and then sold off down to a new low at 5086.75 at 3:25, rallied up to 5095.25 at 3:37 and then pulled back to 5096.75 at 3:49 and traded 5096 as the 3:50 cash imbalance showed $2.18 billion to sell and sold off down to 5056.75 on the 4:00 cash close. After 4:00, the ES sold off down to 5058.50 and then rallied up to 5073.75 at 4:03 and sold off down to 5057.00 at 4:05, rallied back up to 5072.75 at 4:06 and then dropped down to 5051.00 at 4:18 and settled at 5055.00, down 96 points or -1.79%.
The NQ that made a high at 17,920 sold off down to 17,473.50 settled at 17,508.50, down 395.75 points or -2.21%, gold for June delivery fell $54.80 to $2,302.90 per ounce, silver for July delivery fell $1.01 to $26.65 per ounce, and July copper fell 12 cents to $4.56 per pound, crude oil for June delivery fell 70 cents to $81.93 per barrel and Bitcoin closed below $60k and lost over 16% in April, on track for its worst month since November 2022. Everything was moving and not in a good way.
In the end, Yellen's comments and the weak bond markets put a kibosh on the index markets. In terms of the overall tone, the NQ was the weak link. In terms of the ES's overall trade, volume was higher: 213k traded on Globex and 1.342 million traded on the day session for a total of 1.555 million contracts traded.
Technical Edge
NYSE Breadth: 13% Upside Volume (!)
Nasdaq Breadth: 35% Upside Volume
Advance/Decline: 16% Advance (!)
VIX: ~16
S&P 500 — ES Futures
Economic Calendar
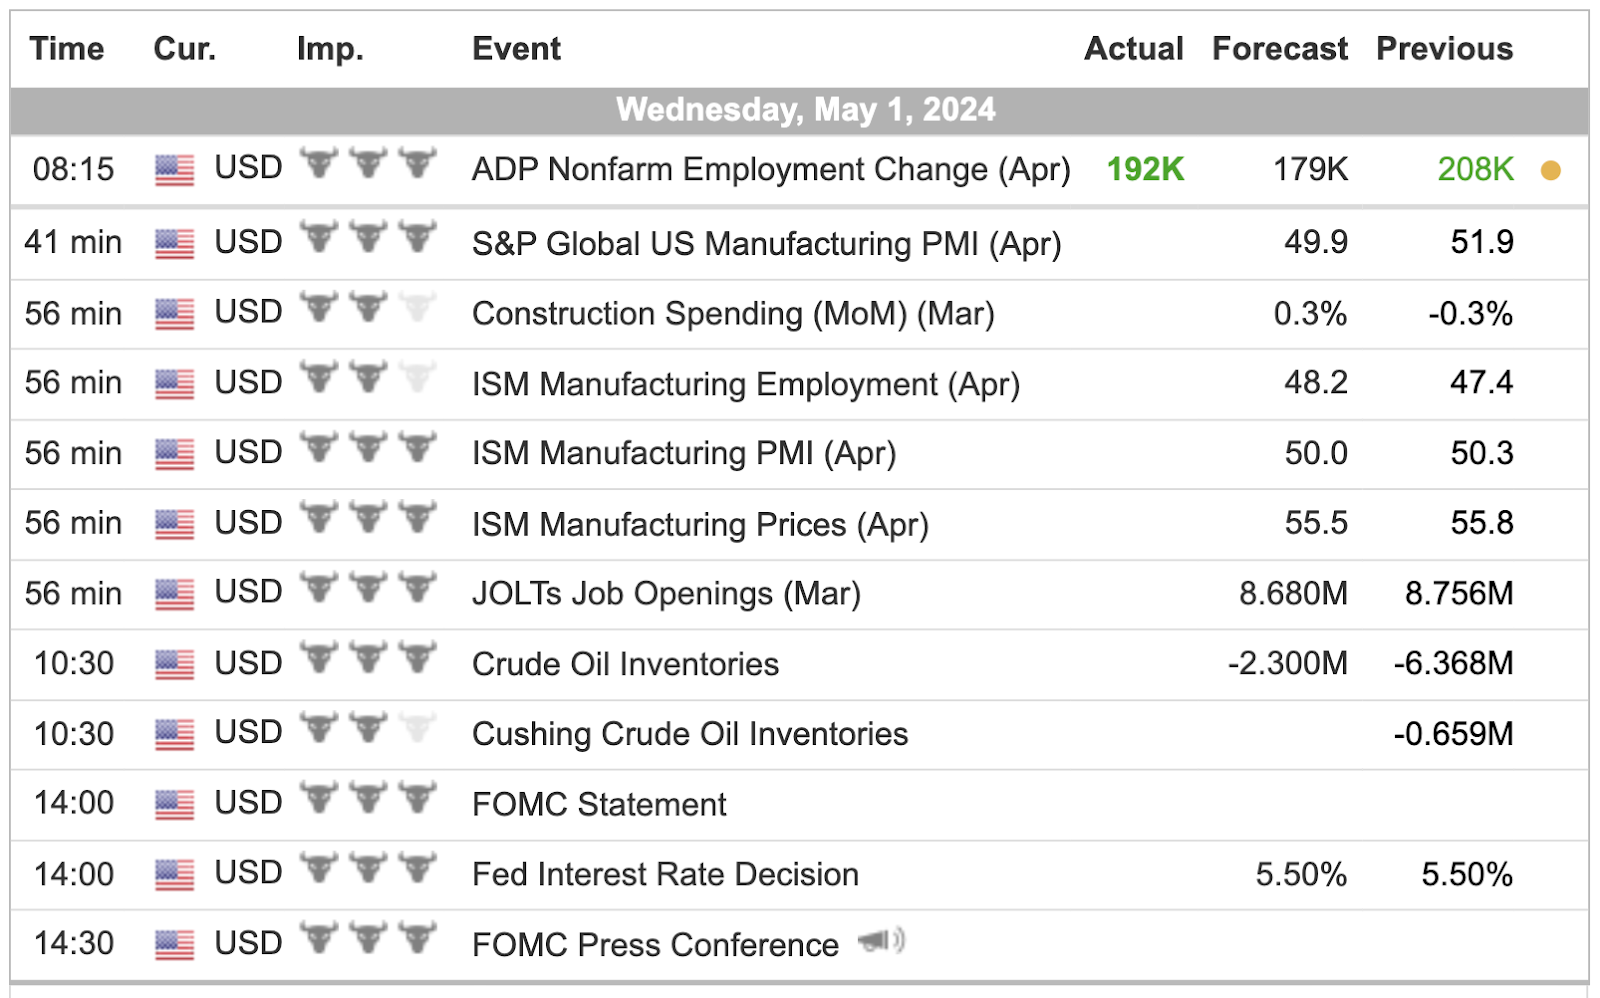
For a more complete Economic Calendar see: https://mrtopstep.com/economic-calendar/